Just some interesting stats. Will probably share more here later when I get around to it, figured that some of you might find this stuff interesting though!
Sadly I do not have the data to do something like that. At best I could poll the connection log to see how many people connected to Bee at some point, but that wouldn’t really provide any useful data or graphics. Just a line going up to show the total number of connections/players.
Am I really this bad at stating my intentions?
I hit a new low every day; damn.
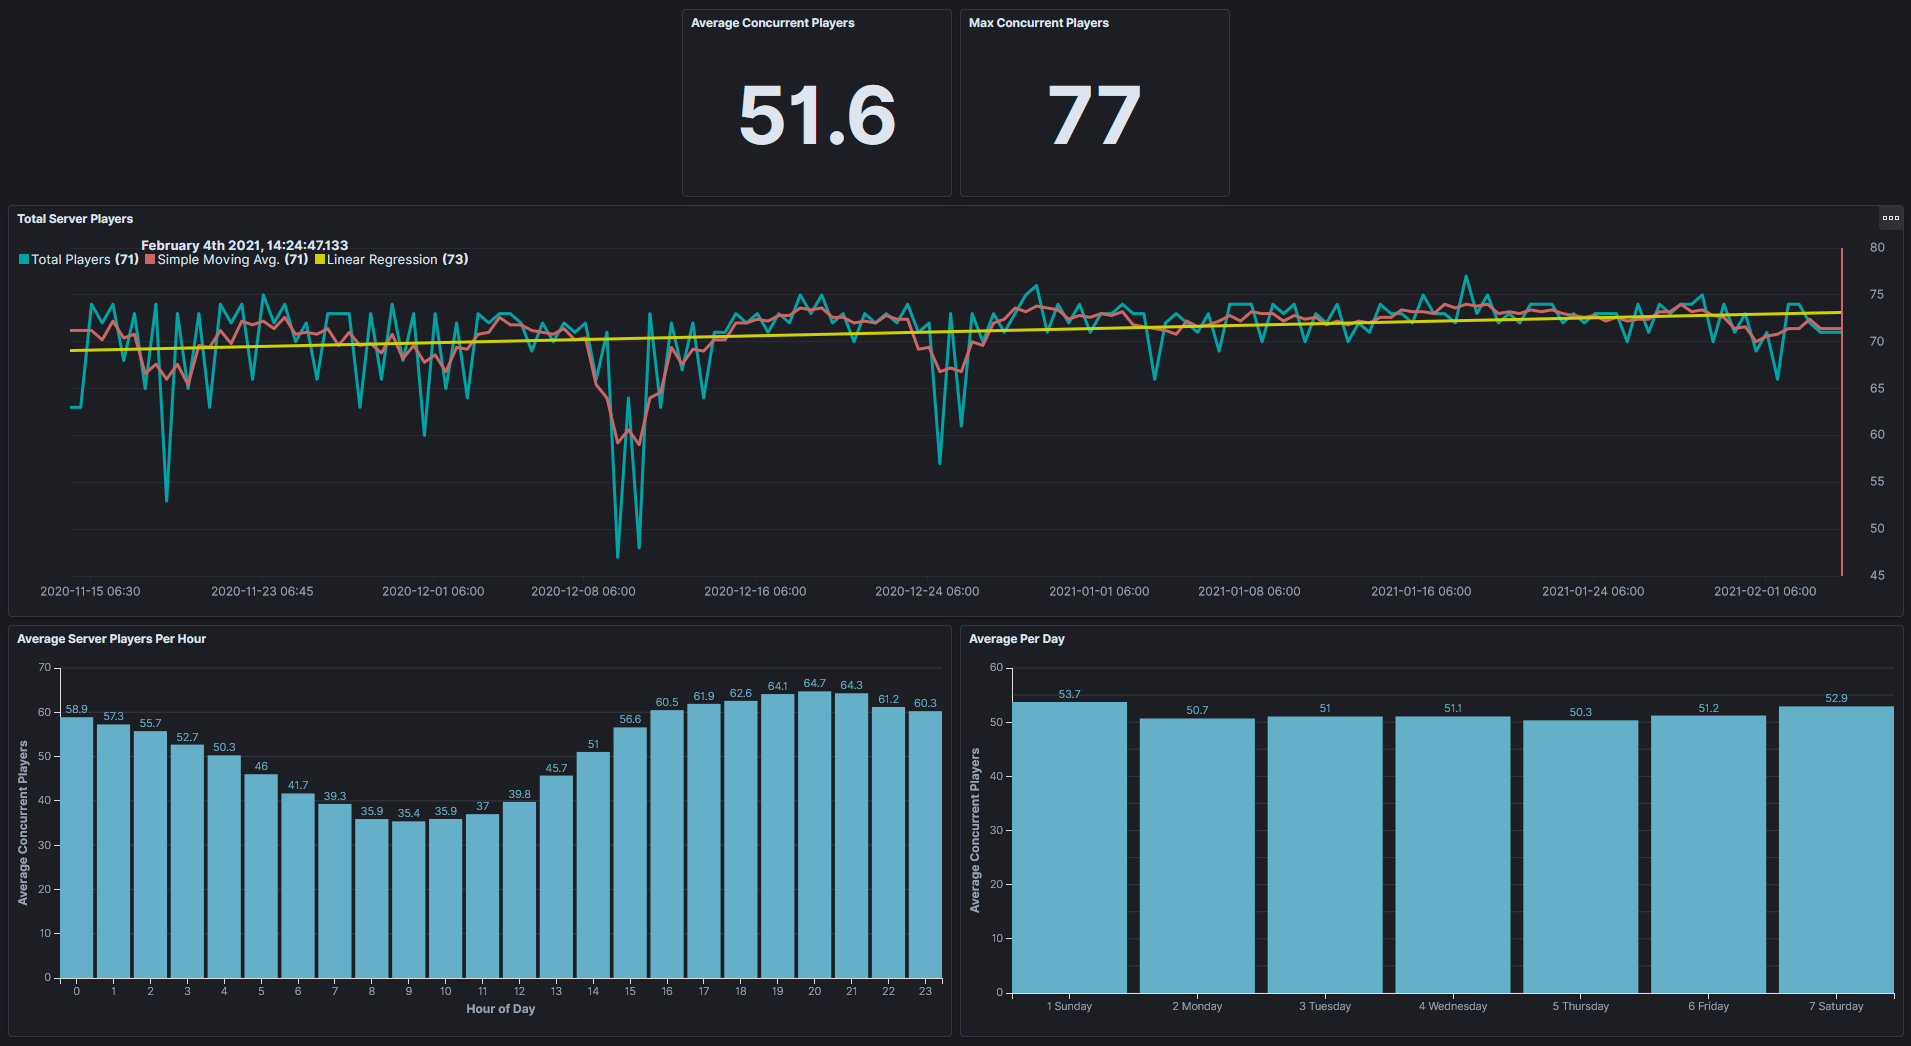
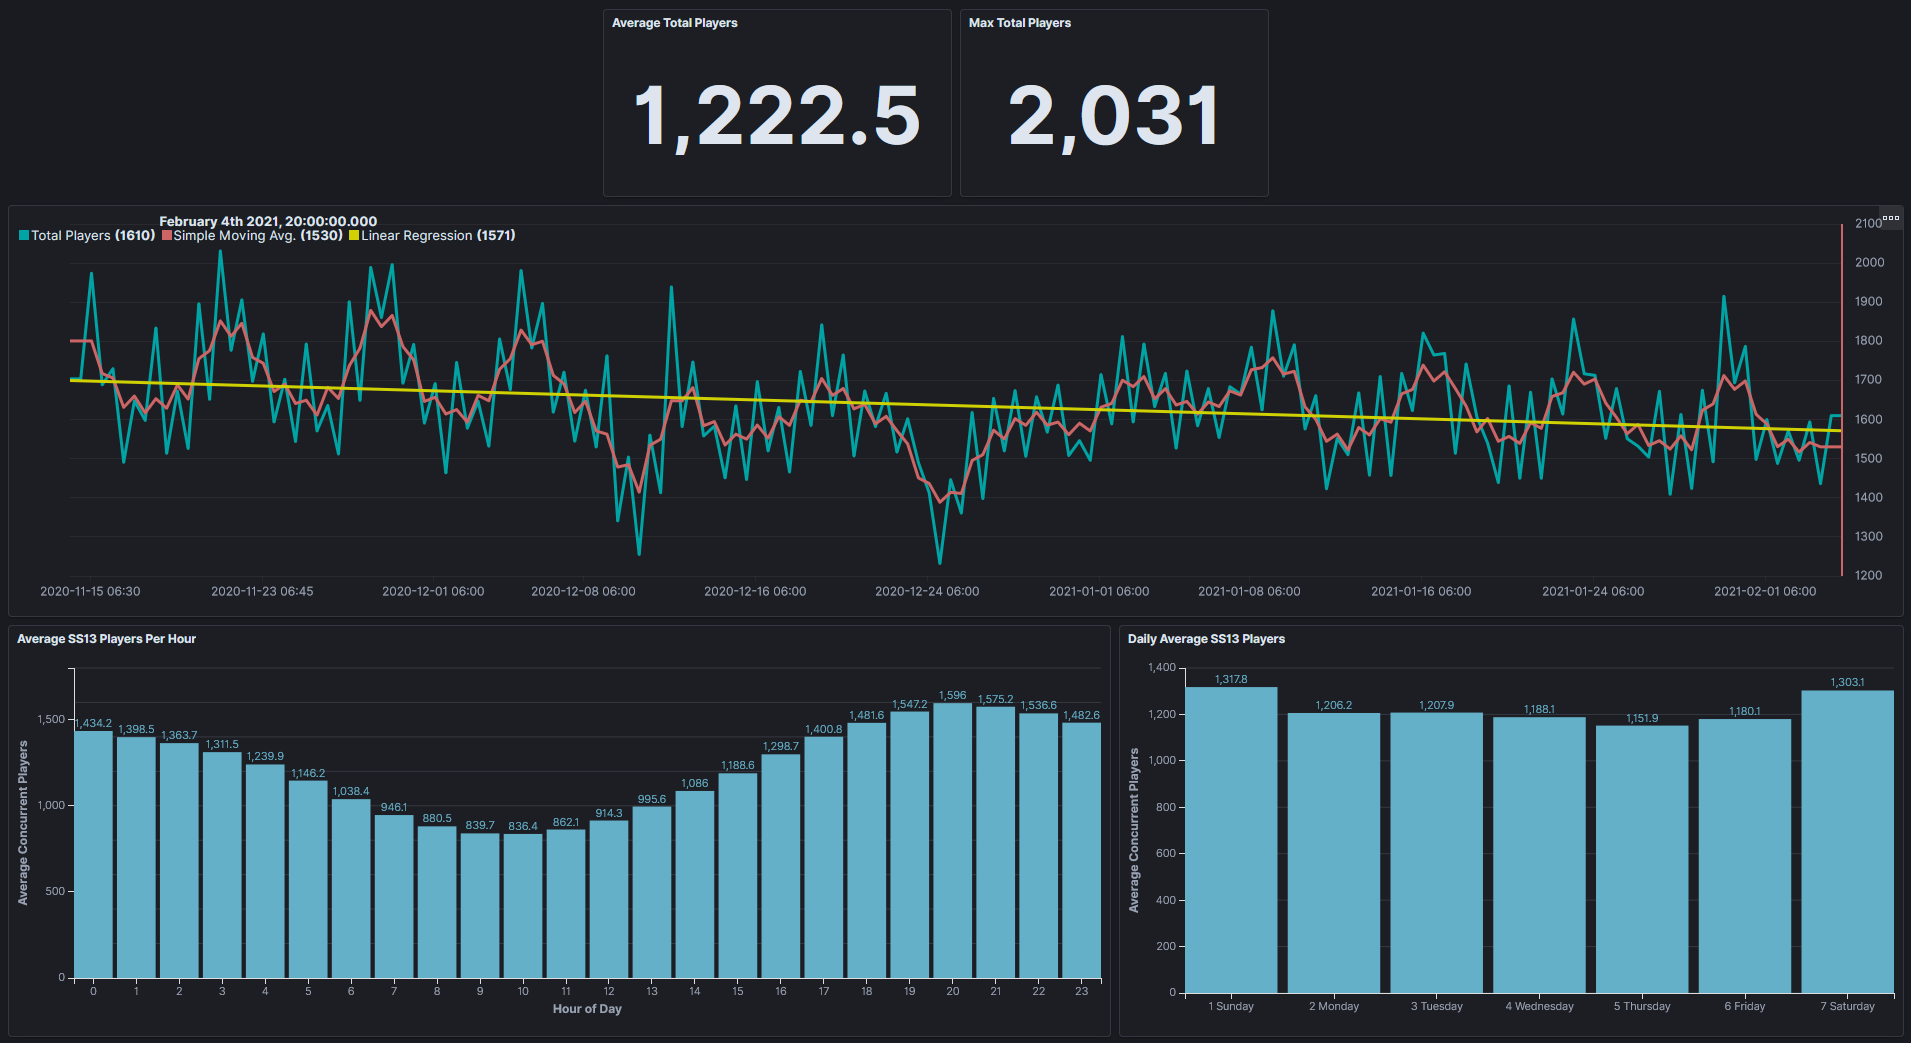
I was hoping to see a chart similar to Concurrent Player Data (November 14th → February 4th)
But for all of bee’s life span instead of a limited time frame; which is not possible most likely since Crossed has stated he does not have the data.
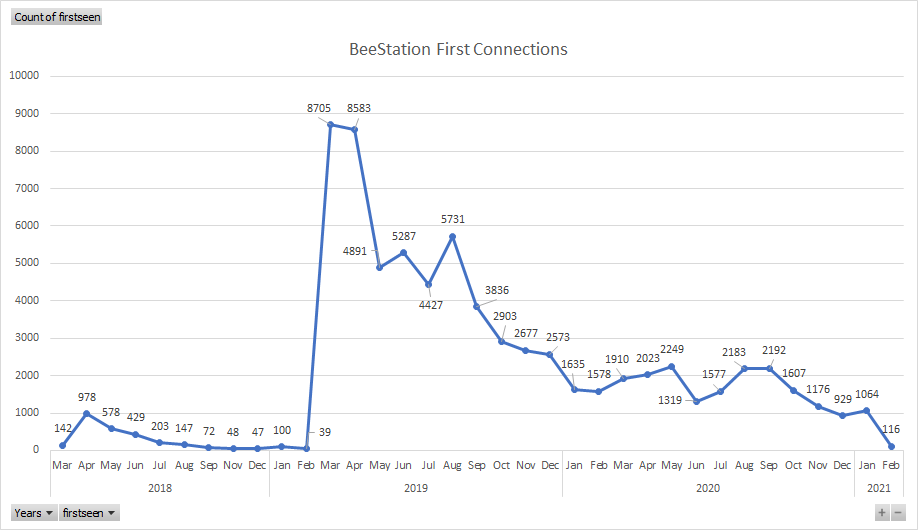
This would be the best I can give on that. Just a rough chart on how many people first connected within a given year (Just threw it together in Excel, so it’s not super pretty). You can at least laugh at the massive spike in 2019 from the Sseth video. The slow downtrend back to normalcy is pretty expected based on the global trend and lack of big advertisements.
Pretty expected. Unless there’s another major advertisement at the same level of Sseth’s videos, there isn’t going to be a massive influx of new players into SS13. Things have globally been slowly returning to baseline.
First understand what the graph is about, then think if you want something out of the graph, e.g stats at a current month/day or looking for peaks or lows.