Was asked in another thread to generate some data on player trends and decided that it might be neat to give a more zoomed out view of things and provide a bit of requested data.
To start us off, I’ll give a zoomed out look at how this year has been thus far.
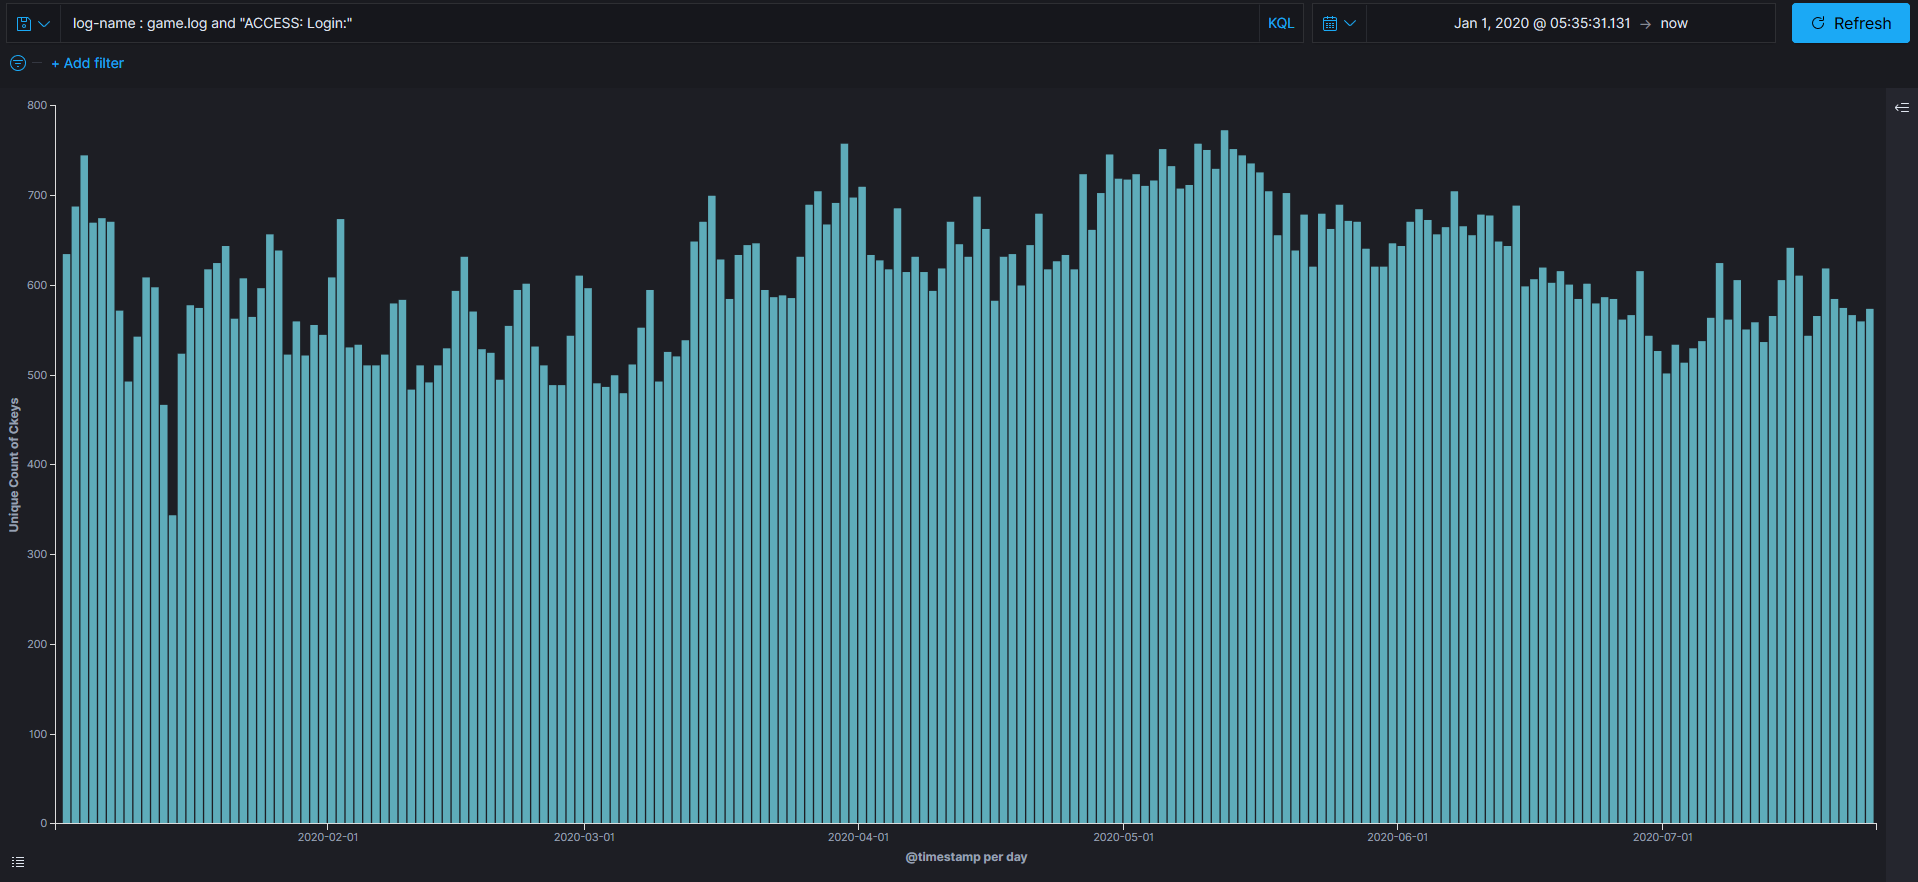
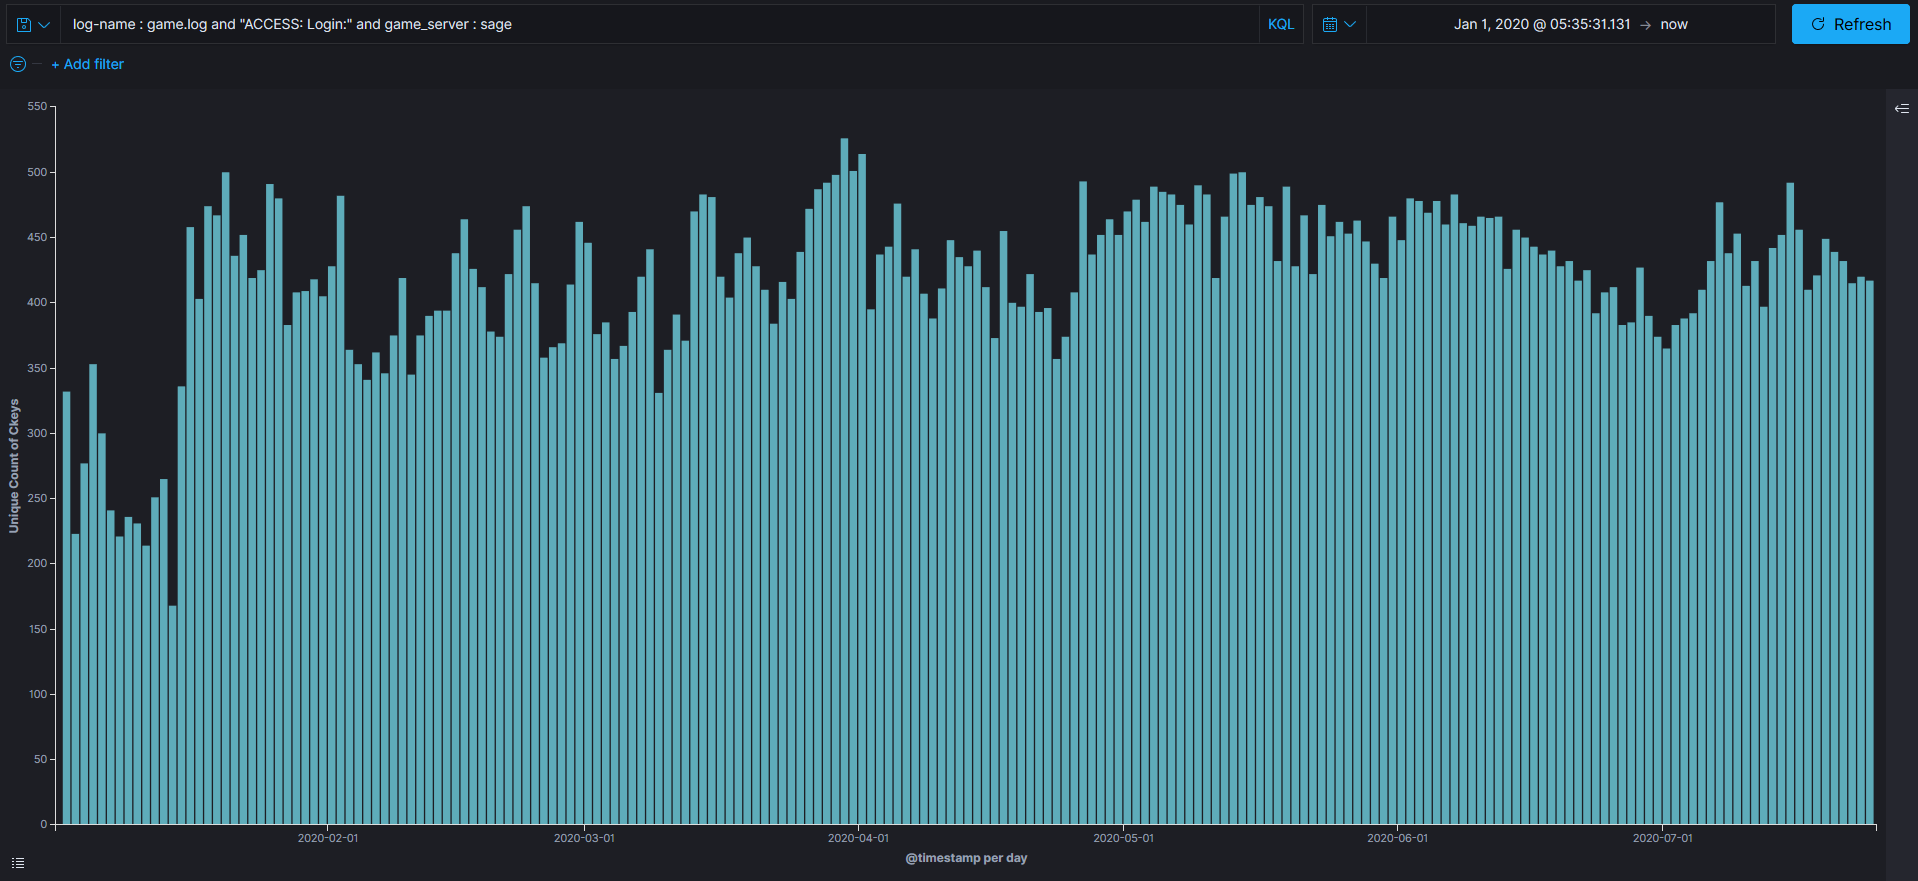
A key date: January 14th had a large dip in players due to an attack on the server. Coincidentally, this also seems to be the date where we noticed a large increase in players on Sage.
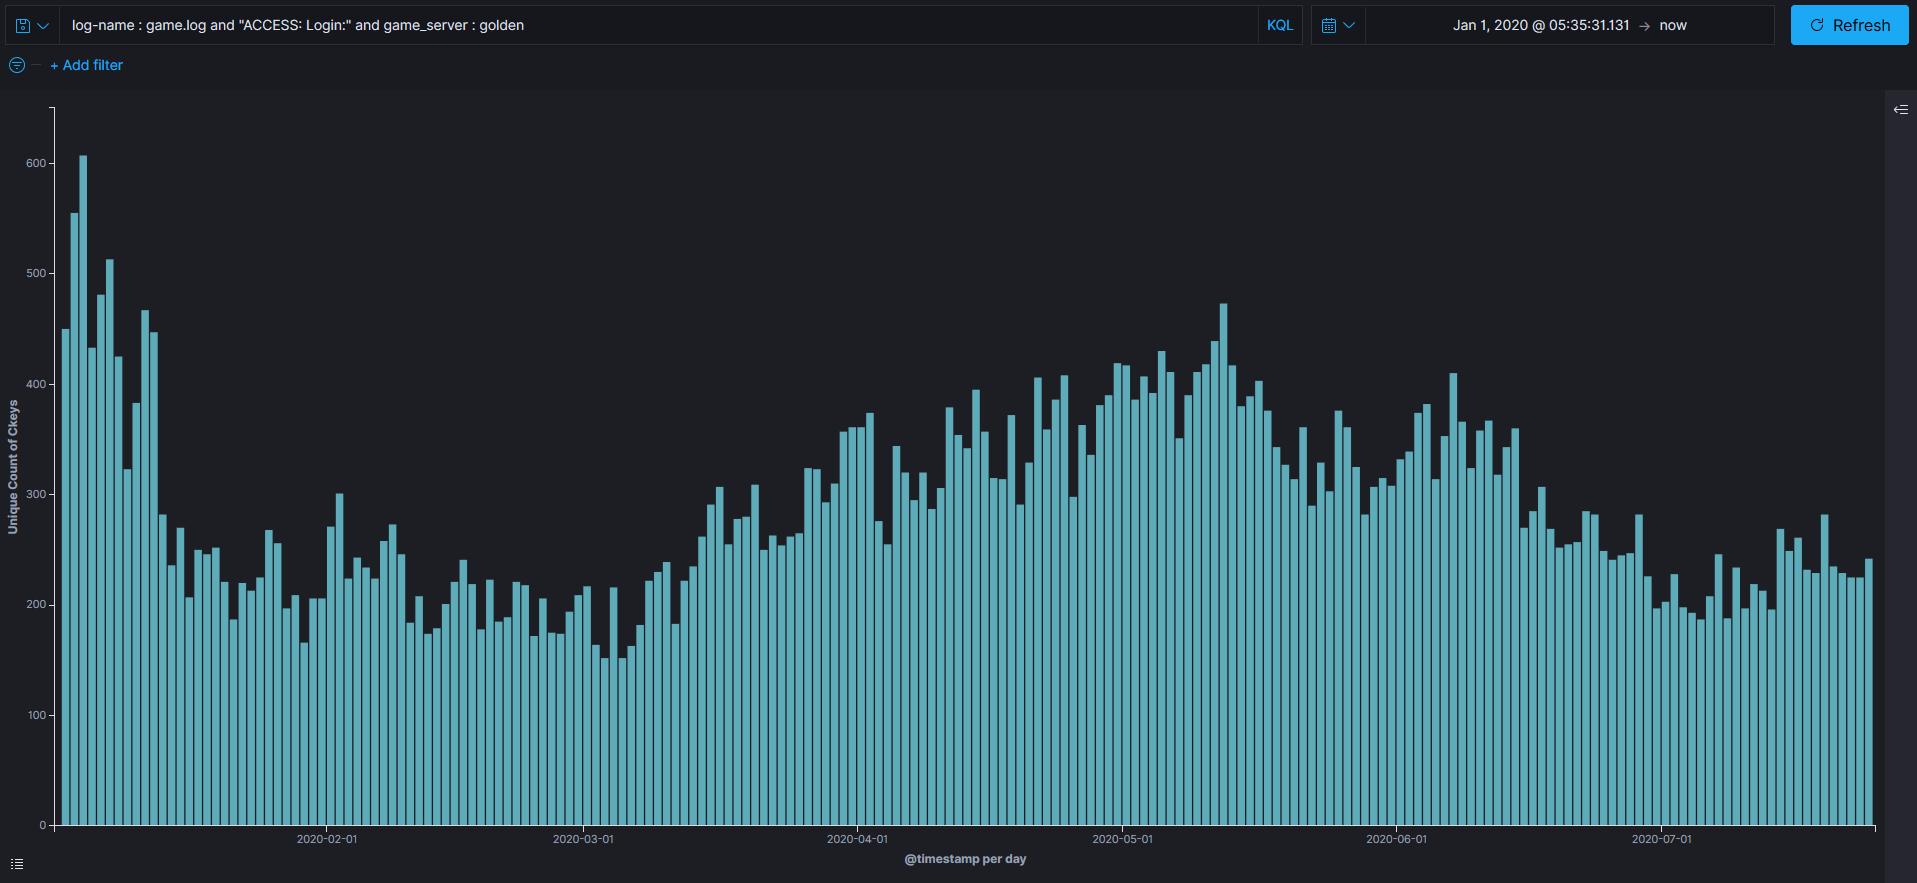
We can also see that our population has largely been pretty stable (Golden individually is a bit of a roller-coaster). Most of our ups and downs can be attributed to fluctuations in the greater SS13 community.
All servers
Golden
Sage
If anyone would be interested in seeing specific time-frames or specific sets of data, let me know. I’ll see what I can pull up! (Forgive me if it takes me some time to respond though)
6 Likes
Thank you hun for this. This will come in very handy when it comes to dispelling the doomsayers that pretend that Bee is dying because of the sensible and ethical changes this community has taken.
1 Like
Sorry, I’m only indexing data from 2020. 
I can’t do a comparison.
@ZoeyTheZany yeah, hopefully it’ll give people a bit of a clearer picture on how we’ve been doing in the grand scheme of things. Sometimes it’s a bit too easy to get sucked into the now and think that things are a lot worse than they really are.
Cool visualization, you should make these graphs public. I’d be willing to integrate them into the website stats page if you do so wish
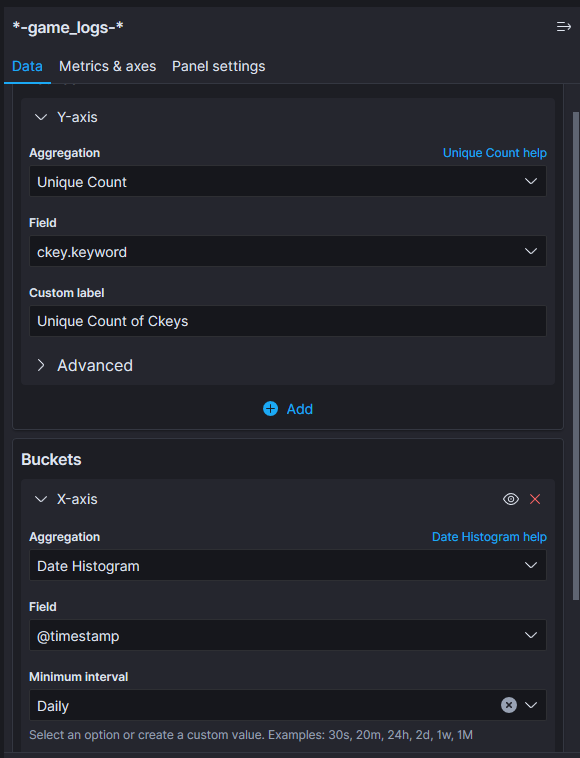
also isn’t the axis a misnomer? it looks like the query you are doing is just counting lines that are ACCESS: Login, which occur every time a user logs in (and/or reconnects…)
not familiar with kibana so maybe you have a bigger query underneath
What you’re seeing is a filter, not a query. I’m filtering results to ACCESS lines to help make the count more accurate. It’s taking all of those lines and then doing a unique count of the ckeys listed per day.